For the past year, I’ve been helping one of my clients with company wide adoption of their enterprise architecture. Their pursuit of this has been long, and filled with challenges. So far, they’ve approached it by utilizing external advisors, communicating rules through the chain of command, facilitating consensus decision making, project manager driven transformations, and creating new lead roles oriented around architecture.
Because previous attempts had failed, we realized that the disposition of the system was not conducive to the change they were hoping to make. But it was also not well understood. So as an alternative to conventional wisdom, we Estuarine Mapped adoption of enterprise architecture.
Despite the training I’ve taken with The Cynefin Company, and the extensive reading I’ve done on Estuarine Mapping, I struggled with practical application. I reached out to The Cynefin Company for a mentor, and once done I wrote this post sharing my experiences. I hope it serves as a useful resource for others considering Estuarine Mapping, and that it answers some of the questions you might have.
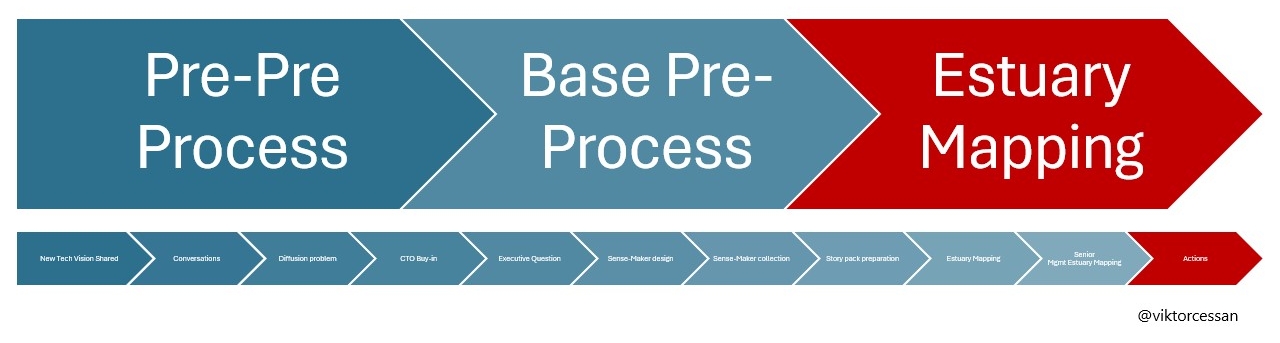
This post begins from before there was an “Executive question”, until when we had Estuarine Maps, and actions started happening–a process that took 10 months.
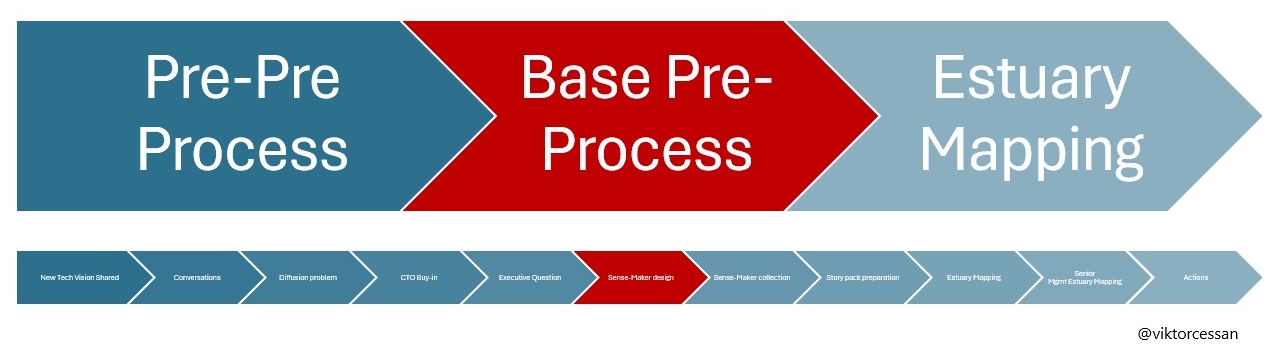
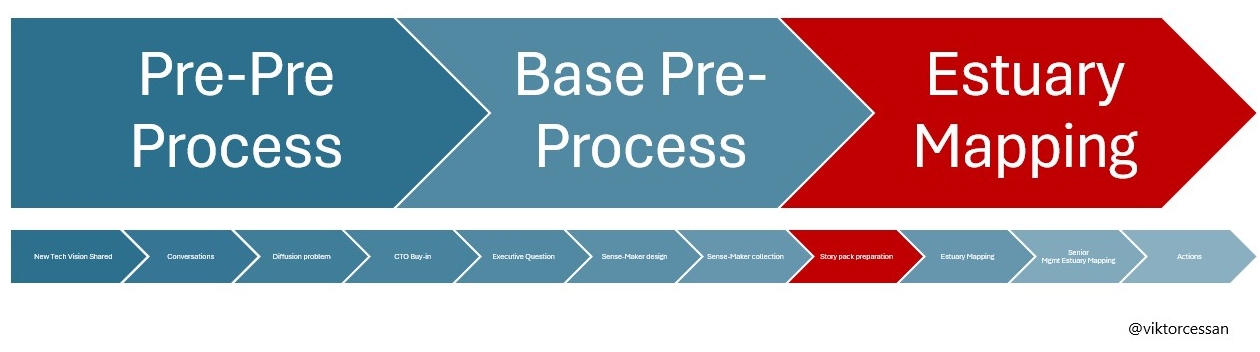
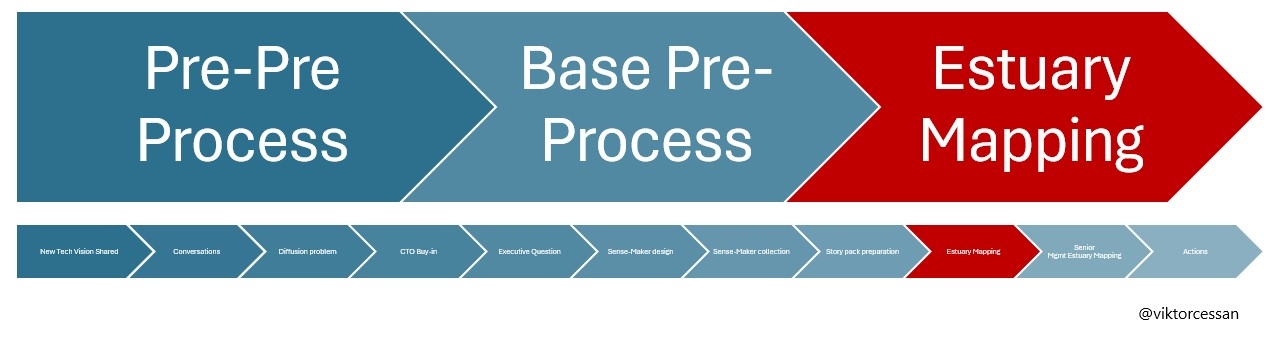
 This timeline show our steps, and the length of our process. It is erroneously depicted in a linear fashion. I’ll get into that later in the post.
Throughout this post, I share confusions, thoughts, my learnings, pitfalls I fell into, and what I’d do differently next time.
Disclaimer. This is not peer reviewed–several of my learnings may in fact be incorrect from the point of view of The Cynefin Company’s frameworks. But nonetheless, this represents my current understanding of Estuarine Mapping.
At the end of this post, I summarize my learnings without any story. Skip ahead there if that’s what you prefer to read.
Sensing weak signals
A brief background is essential, as it sets the stage for the challenges. My client’s technology landscape was deteriorating. The technology landscape was becoming more fragmented, duplication of efforts were increasing in frequency, and both the cost of maintenance and development were escalating.
Over the years, the CTO had noticed these issues intensifying and had responded by crafting a new technology vision. To bring this vision to life, a new organization was launched. However, despite these efforts, no significant progress was evident post-launch. The envisioned changes were not being reflected in the teams’ roadmaps or backlogs, and product teams that could have benefited from leveraging new efficiencies continued to operate in isolation, reluctant to deprecate their existing duplicated solutions.
Hints of diffusion problems
As I explored this, I discovered diffusion problems: at the high level, the CTO had abstracted and codified the deteriorating technology landscape into a/his technical vision. However, this vision was not codified into a lower abstraction by technical leaders, and this was leaving teams at a loss of guidance. Now, reading that, it may be easy to think “Why don’t you just fix that then? Gather the senior devs, architects, and engineering managers, and ask them to get started”. But that was a part of the problem. In both past and present, numerous efforts like that had been made. This had been one of the whole points with the new organization.
But, paraphrasing one engineer post-launch of the new organization: “I love the vision, but I have no idea how to make any concrete progress towards it. We aren’t receiving any support to understand what it means for us, our Engineering Manager is overwhelmed, and our immediate day-to-day contacts, and users don’t care about this.”
The more I spoke with various managers, developers, architects, and stakeholders, the more I encountered polarities, division, and deep nuances—entanglements that senior management had not detected.
Avoid tyranny of the explicit
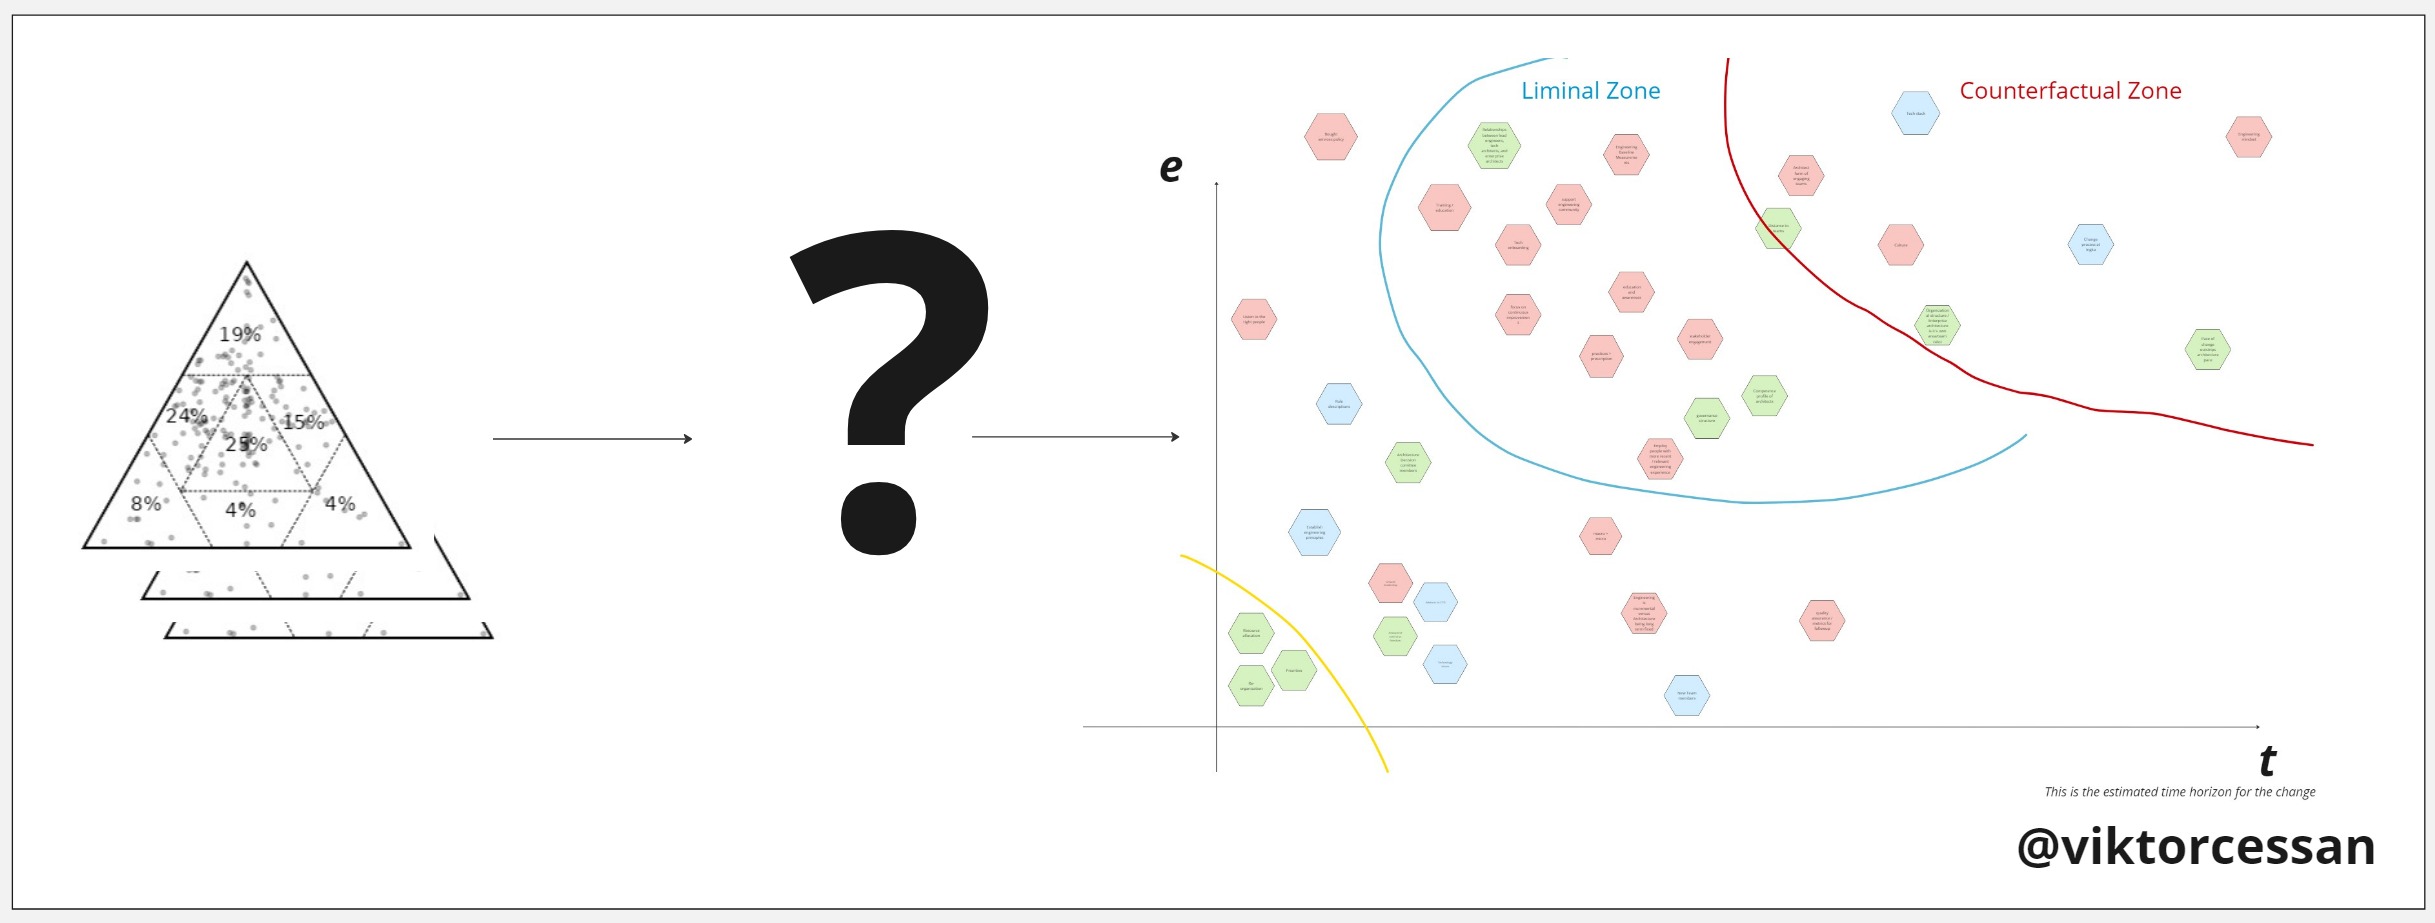
As I continued to speak to various people, I compiled an anecdote library filled with peoples stories. I met with groups and listened to their stories.I also visualized stories through graphs, and causal loop diagrams. This is how I used to work with change. However, this approach made me uncomfortable, as I felt I was becoming the “tyrant of the explicit”—over-simplifying rich, nuanced information into overly clear and direct models.
This was one of my first major challenges: To help this client improve adoption of their enterprise architecture, the CTO needed to understand the disposition of the system. To understand the disposition, the CTO needed (to buy into the work of doing) Estuarine Mapping. To buy into the work, he’d need to understand why the current way was not working which means having an accurate representation of the present.
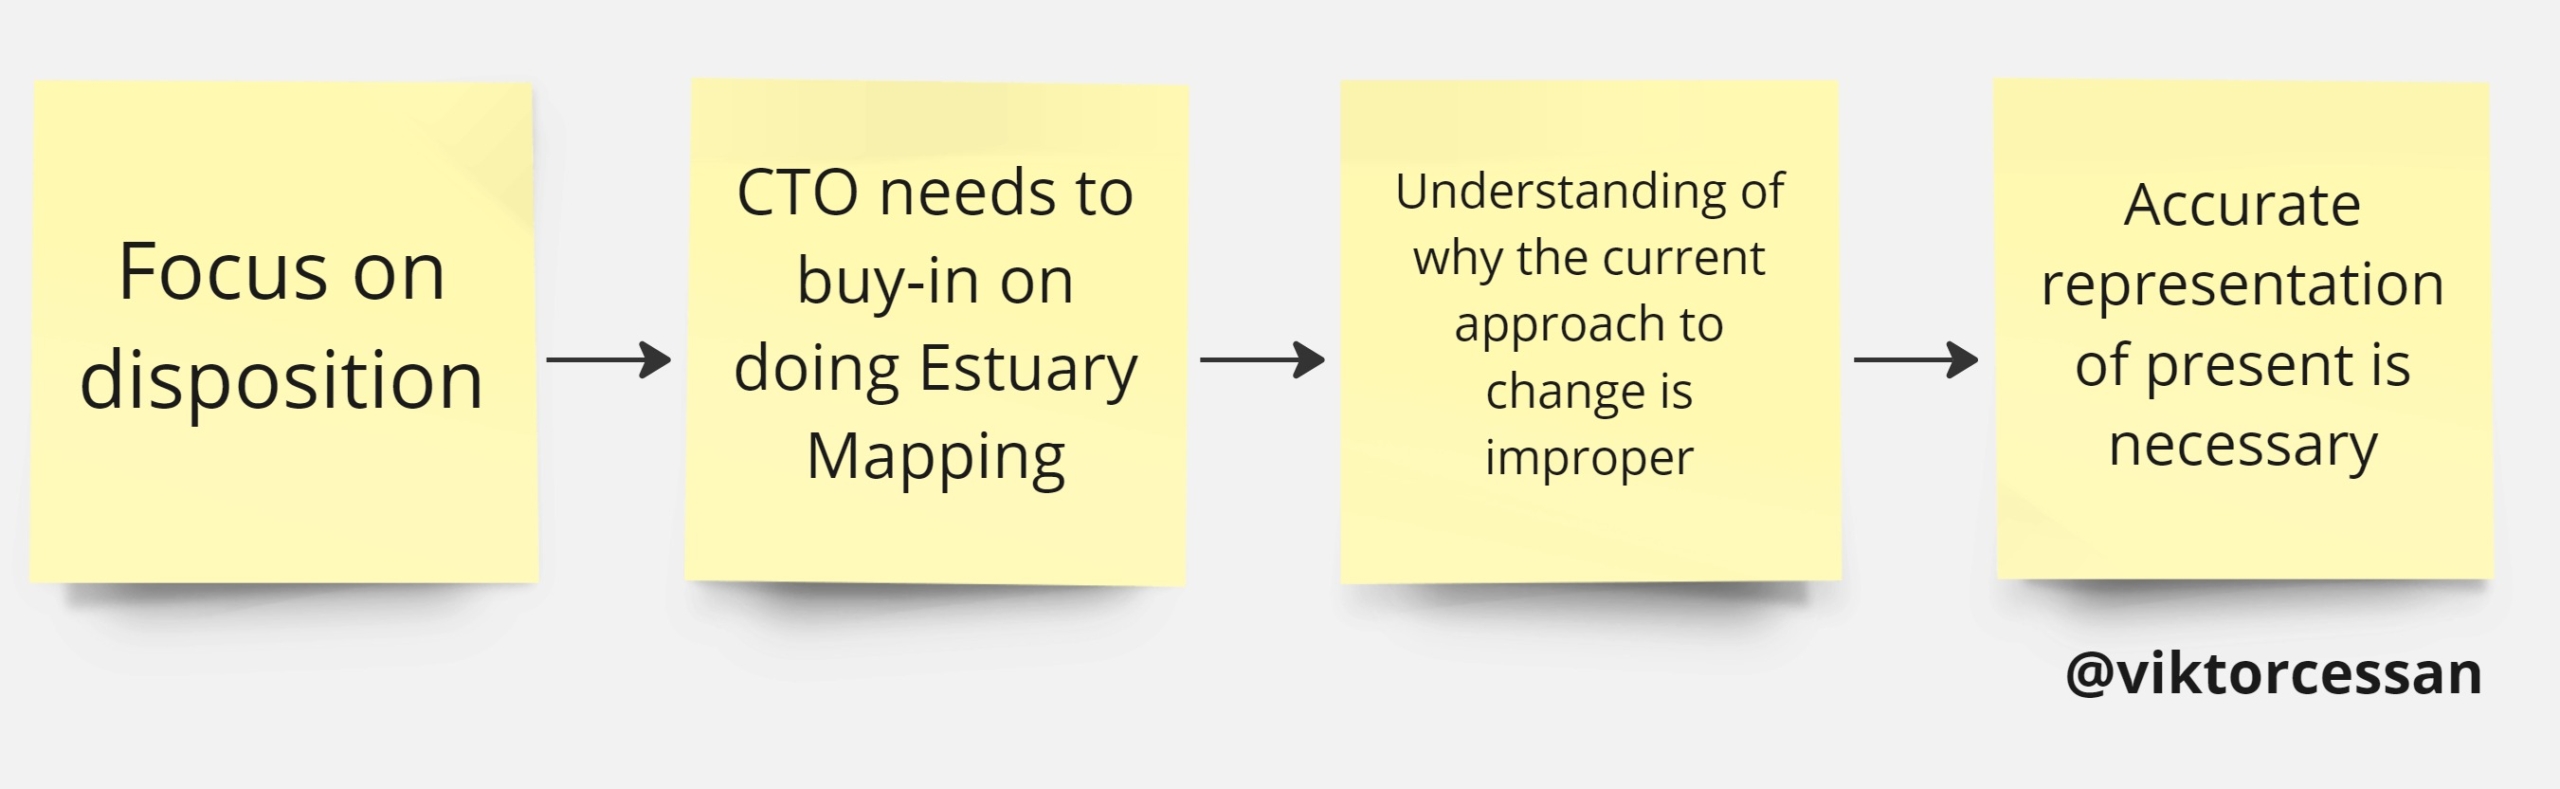
In short, I was stuck, and wondering How do I describe the present accurately (enough) without falling into the tyranny of the explicit?
There was a risk that my portrayal would either reinforce the CTO’s existing biases, leading him to double down on ineffective strategies, or that it would appear so foreign that he would dismiss it outright.
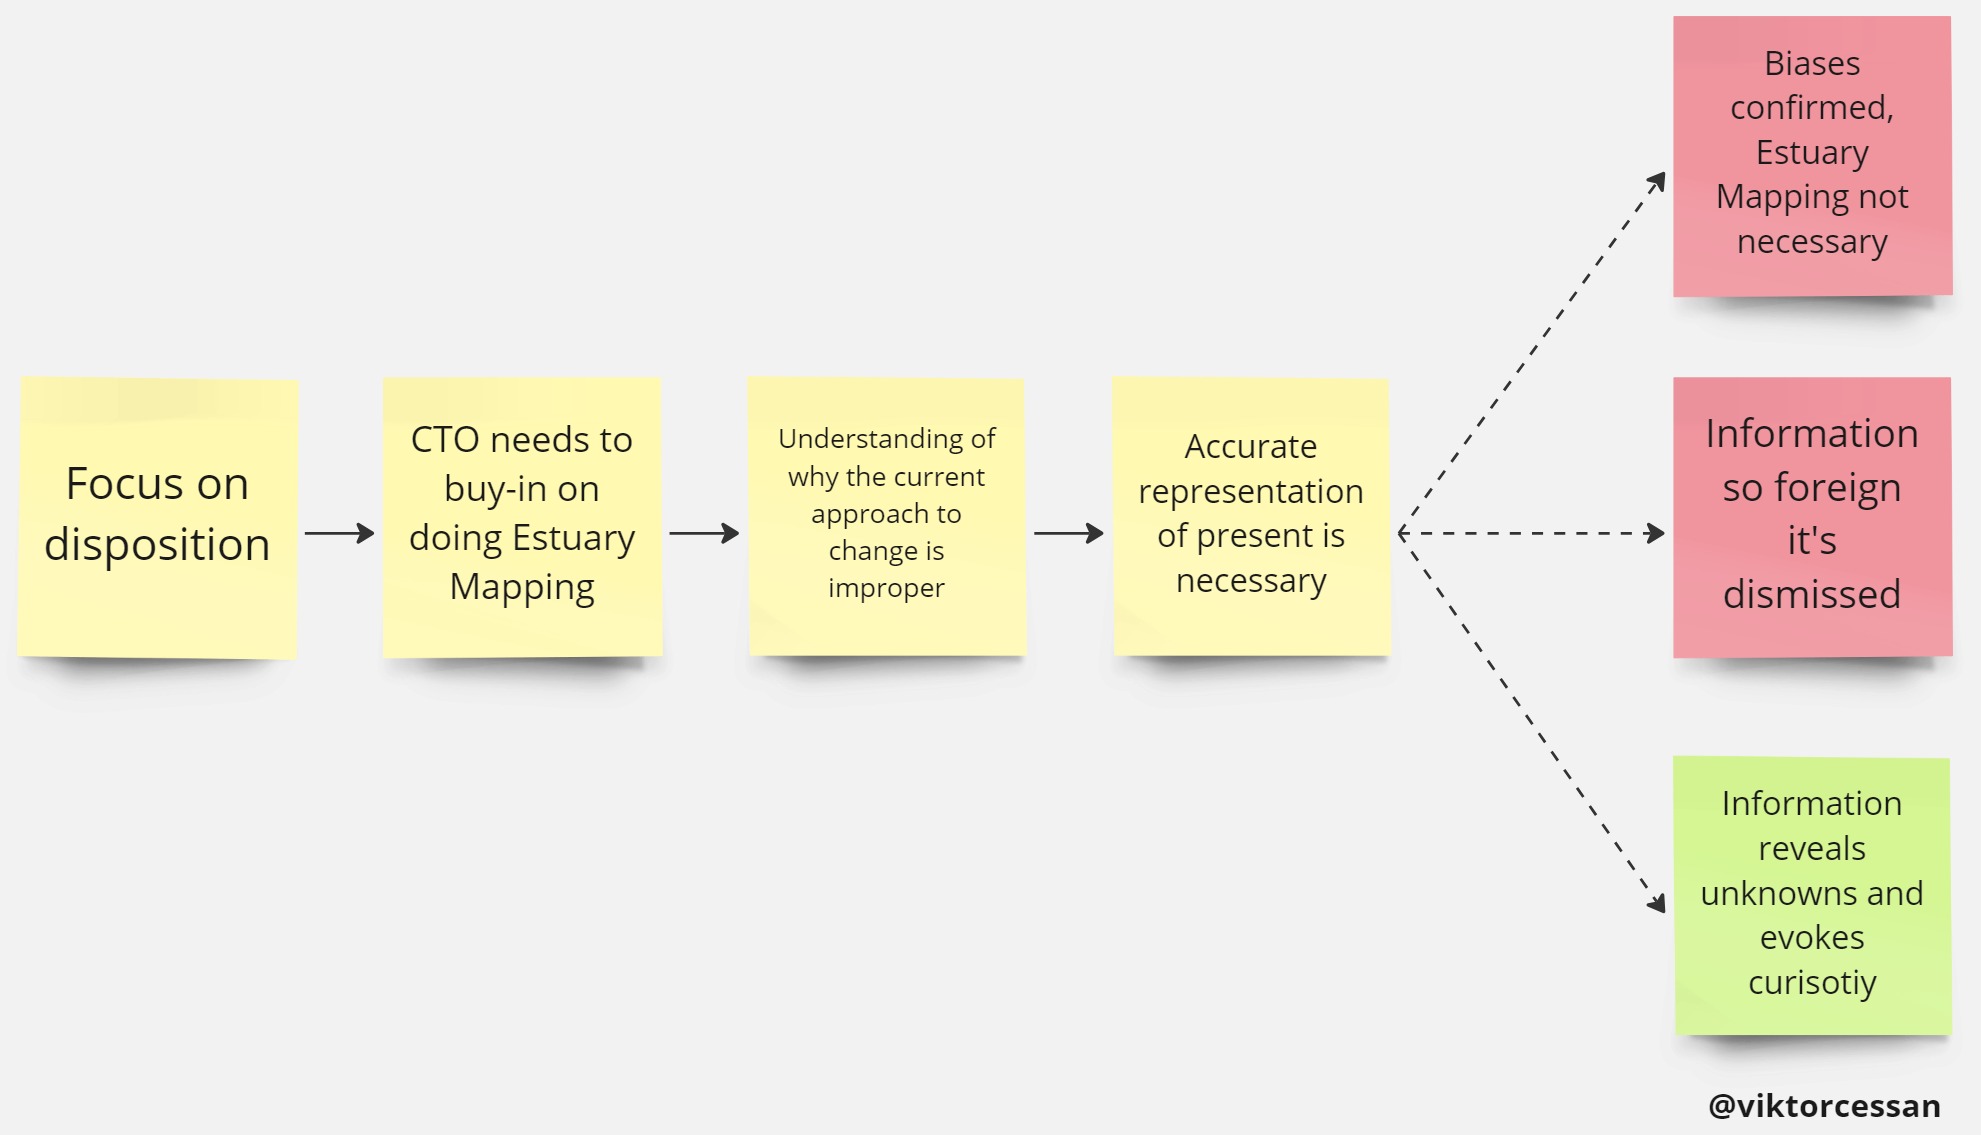
The answer was of course that I can’t accurately describe the present without having the groups do Estuarine Mapping, and it was a bit of a catch 22. I needed an Estuarine Map to get buy-in to do Estuarine Mapping.
Getting executive buy-in
Anyway, I shared peoples stories with the CTO, and my visualizations, together with heavy disclaimers about this being a small sample and at best only partially true. I shared the multiple hypotheses that peoples stories highlighted. And I was able to evoke curiosity, and illuminate multiple realities that co-existed.

I also shared example screenshots from other public examples of Estuarine Maps, and from SenseMaker® contour maps. I briefly described the level of insight one can get from that, and I got buy-in to launch a SenseMaker® story collector, and to proceed with Estuarine Mapping.
I’d like to think that the reason I got buy-in was from my performance, and my ability to delicately balance sharing nuanced information with being clear, but I think it had more to do with the CTOs background, and personality–his openness, ability to carry multiple perspectives at once, and understanding of complexity. But I also think the timing was right. He’d been there long enough, and had seen multiple cycles of conventional wisdom not work.
Leverage executive sponsorship without taking over liability
Getting the CTOs approval and sponsorship would prove crucial at many occasions. First, Estuarine Mapping is no small task. It’s a new way of thinking about risk, systems, and change, and it requires people to spend a significant portion of their limited time on something novel. Attention is usually scarce, and this would add to the scarcity. Having the CTOs sponsorship increased the legitimacy of when I’d ask people for their time.
But also, the CTO was necessary to set the Executive question that I needed to shape our story collection. It also helped get past the hurdles with procurement of SenseMaker®, and sending information and the story collector out to the organization.
Treat this as a process, not a fixed timeplan
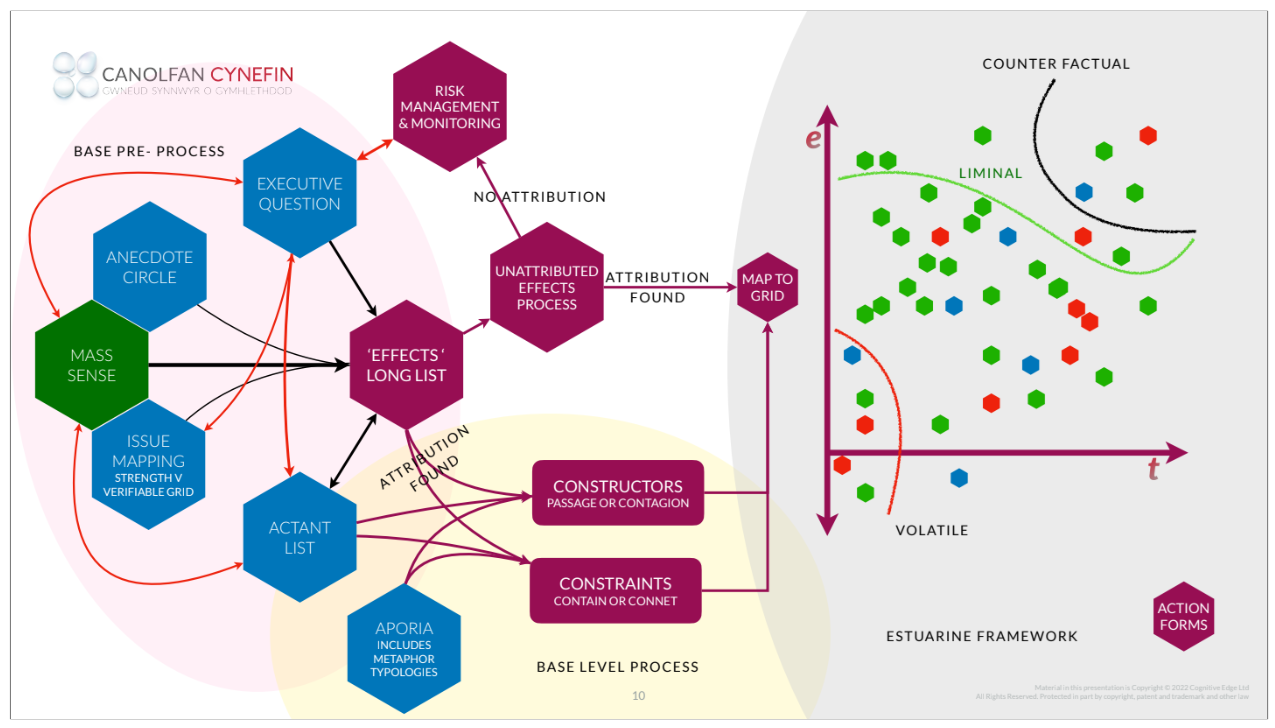
At the beginning of this post, I shared a linear timeline but what guided me was the picture above. It shows different centers that all link to Estuarine Mapping. I didn’t do everything on Canolfan Cynefin, and I did some things less formal than other things such as Anecdote Circles. But throughout my work, I was guided by “doing the next right thing” considering constraints, and discoveries whatever those were.
My point with the timeline is to show the seriousness of the work we did. This is not something one does on a whim. It requires deep thinking, curiosity, and commitment. I will make a few additional references to my timeline from a storytelling perspective, but the timeline was created retrospectively once I had concluded the final workshops when actions started happening, when I wrote this post.
The importance of patience
Continuing with my story, It’s been several months since I started engaging in conversations with people across the organization. Months since I realized that there’s a codification and diffusion problem. The CTO is bought in on collecting people’s stories with the SenseMaker®, and that I then proceed with Estuarine Mapping.
I’m realizing this process takes time. And that there’s the time I actively spend doing work, time I spend waiting, and time I spend thinking. There’s a lot of waiting, and thinking time. I don’t like the idea of rushing this, so I wait. I think this process might trigger a lot of readers impatience to the degree that they drop this mid-way. In my case, which coincidently turned out to be a good thing, Estuarine Mapping was my side gig. I spent ~20% of my time on this.
I speak to Tom Kerwin about this, who’s also done Estuarine Mapping, comparing notes and he mentions:
“Many organizations [ref to tech companies] don’t really understand Estuarine Mapping, and if it’s their first contact with it, it’s almost good if you’re doing it as a side thing, and it happens over time”.
So if you’re an agile coach, or engineering manager, or change leader, and you think you want to change your organization and push a change that you think that Estuarine Mapping is perfect for, you might want to reconsider. Or at least, don’t make it your full time task. Especially if you don’t know how to do it, and the client does not have any pre-exposure to it.
Get a mentor, you’ll need it. No seriously.
Ok, so by now, I’m moving forward to designing a SenseMaker®, and I’m becoming painfully aware that I don’t know how to design a story collector.
I’ve responded to several myself (in trainings I’ve attended), I’ve attended webinars, I’ve read blog posts about, and I have attended several Estuarine Mapping trainings (plural).
When looking at them (the story collectors), they seem fairly simple, but like most things, when I sat down and tried it myself, I realized that there’s a lot of implicit knowledge that I wasn’t aware of. For example, how much context should I share in the introduction to the story collector? What types of questions do I use, in what order, and how many questions are ok? What demographic indicators do I collect? And what sample size do I need?
I meet with my mentor, Jules Yim, on a tri-weekly cadence and she helps me.
“Start with an open-ended question that the respondents can relate to. Avoid over-constraining the question. The open ended question orients thinking.”
From there, she suggested the order of triadic questions, dyadic questions, and to end with demographic indicators.
Design for prompt elegance over asking too many questions
When I first designed the story-collector, I wanted to ask 30 questions, but Jules showed how many weak signals can be detected from combining questions and demographic indicators. So instead of asking loads of questions which risks putting people off and having them just close the story collector, she suggested I ask fewer, clearer, and purer questions leveraging combinations of triads, dyads, and demographic indicators to allow for filtering. Jules called this “Prompt elegance”.
Thanks to this, we were able to explore similarities, and differences in multiple dimensions, with very few questions–thirteen to be exact, excluding demographic indicators.
Trial the story collector
I tried three versions of the introductory open-ended question with employees to see which one they most easily could understand and relate to. I was trying to understand which question got the most answers with the fewest clarifying questions. As we were sending this out to over a thousand potential respondents, it seemed quite important that people could answer.
In our case, I started with the term architecture. But “architecture” was poorly understood and I got lots of follow up questions. I shifted the question and tried again until the prompt activated people. I don’t know if this is correct or not. But because there are so many nationalities, locations, and roles participating, this was necessary.
One important learning here was the importance of using language that already exists, that people understand and can relate to. And as someone who is semi-external, the language in use is not always obvious before trialing the prompts.
Paraphrasing the open ended question we decided to start with: “A close friend asks you what it’s like to develop products with your company’s enterprise architecture, what story do you tell them?”.
From there, we proceeded with six triadic questions, and three dyadic questions. We also ask if people want to see more examples like their story, or less, so that we can see the attitudinal orientation.
We added one more open-ended question: “A decision I would like to influence, related to our Enterprise architecture is…”, and then we prompt to see whether people perceive this decision to be relevant only to them, the industry, or all companies in the world. This way, we could distinguish between local and global problems…for a lack of better terms.
The last questions were demographic indicators. I asked people to specify organizational belonging, role, tenure, location, # of roles they’d had (one hypothesis was that # of roles correlated with liminal thinking), and if they worked remote, hybrid, or from the office.
Help decision makers understand the difference between a survey and story-collector
During the design, and trial of the SenseMaker®, people questioned why we used the SenseMaker® platform. I had several conversations with decision makers (luckily reporting to the CTO) about using “Microsoft Forms” instead. There wasn’t any malice behind their ambition. This was simply an illustration of their conventional wisdom. I overcame this misunderstanding by showing screenshots from other public SenseMaker® examples highlighting the type of insights we could gather from a SenseMaker®. In the three conversations I had, everyone understood the difference once they’d seen the two platforms side by side along with the data that can be extracted.
Sense-making and SenseMaker® are to surveys what gasoline is to an electric car.
I also made a concerted effort to not call this a survey. I called it a story collection platform, and also made it explicit that it is very different from a survey.

Example of a SenseMaker® story collector
Determining and understanding what sample size to aim for
In terms of sample size, I first thought it would be enough with 20 responses, but got the guidance to aim for at least 150 responses with broad representation from roles and organizations because that’s what was necessary for pattern revealing. And after that, more responses would contribute to pattern enhancement. Or at least, that’s how I understood it. In our case, we got closer to 200 responses which equated to 15% of the total size.
Running this end to end is not a one person job
This is where I faced my next challenge. So by now I have my 200 responses and my next step is to arrange Estuarine Mapping sessions. How do I move from having loads of answers in a SenseMaker®, to having Estuarine maps?
Preparing a pre-read story pack for the Estuarine mapping sessions
I feel stuck again and I am unsure how to proceed. One idea I have is that I read through everyone’s stories, look at all graphs, and that I personally extract modulators that the groups can work with. Note that I’m using the term “modulators” as a catch-all phrase for constraints, constructors, actants, and effects. But I remember from my most recent training on Estuarine Mapping that I should not pre-extract modulators as the facilitator. Because if I pre-extract modulators, I am filtering out weak signals and distributing My personal interpretation of peoples stories.
So what do I do with all the stories that we have collected? I already have groups lined up for Estuarine Mapping. Do I just give them access to SenseMaker®? Do I present the SenseMaker® in the meeting? How would I know what to even present? What should I do?
Again, Jules to the rescue.
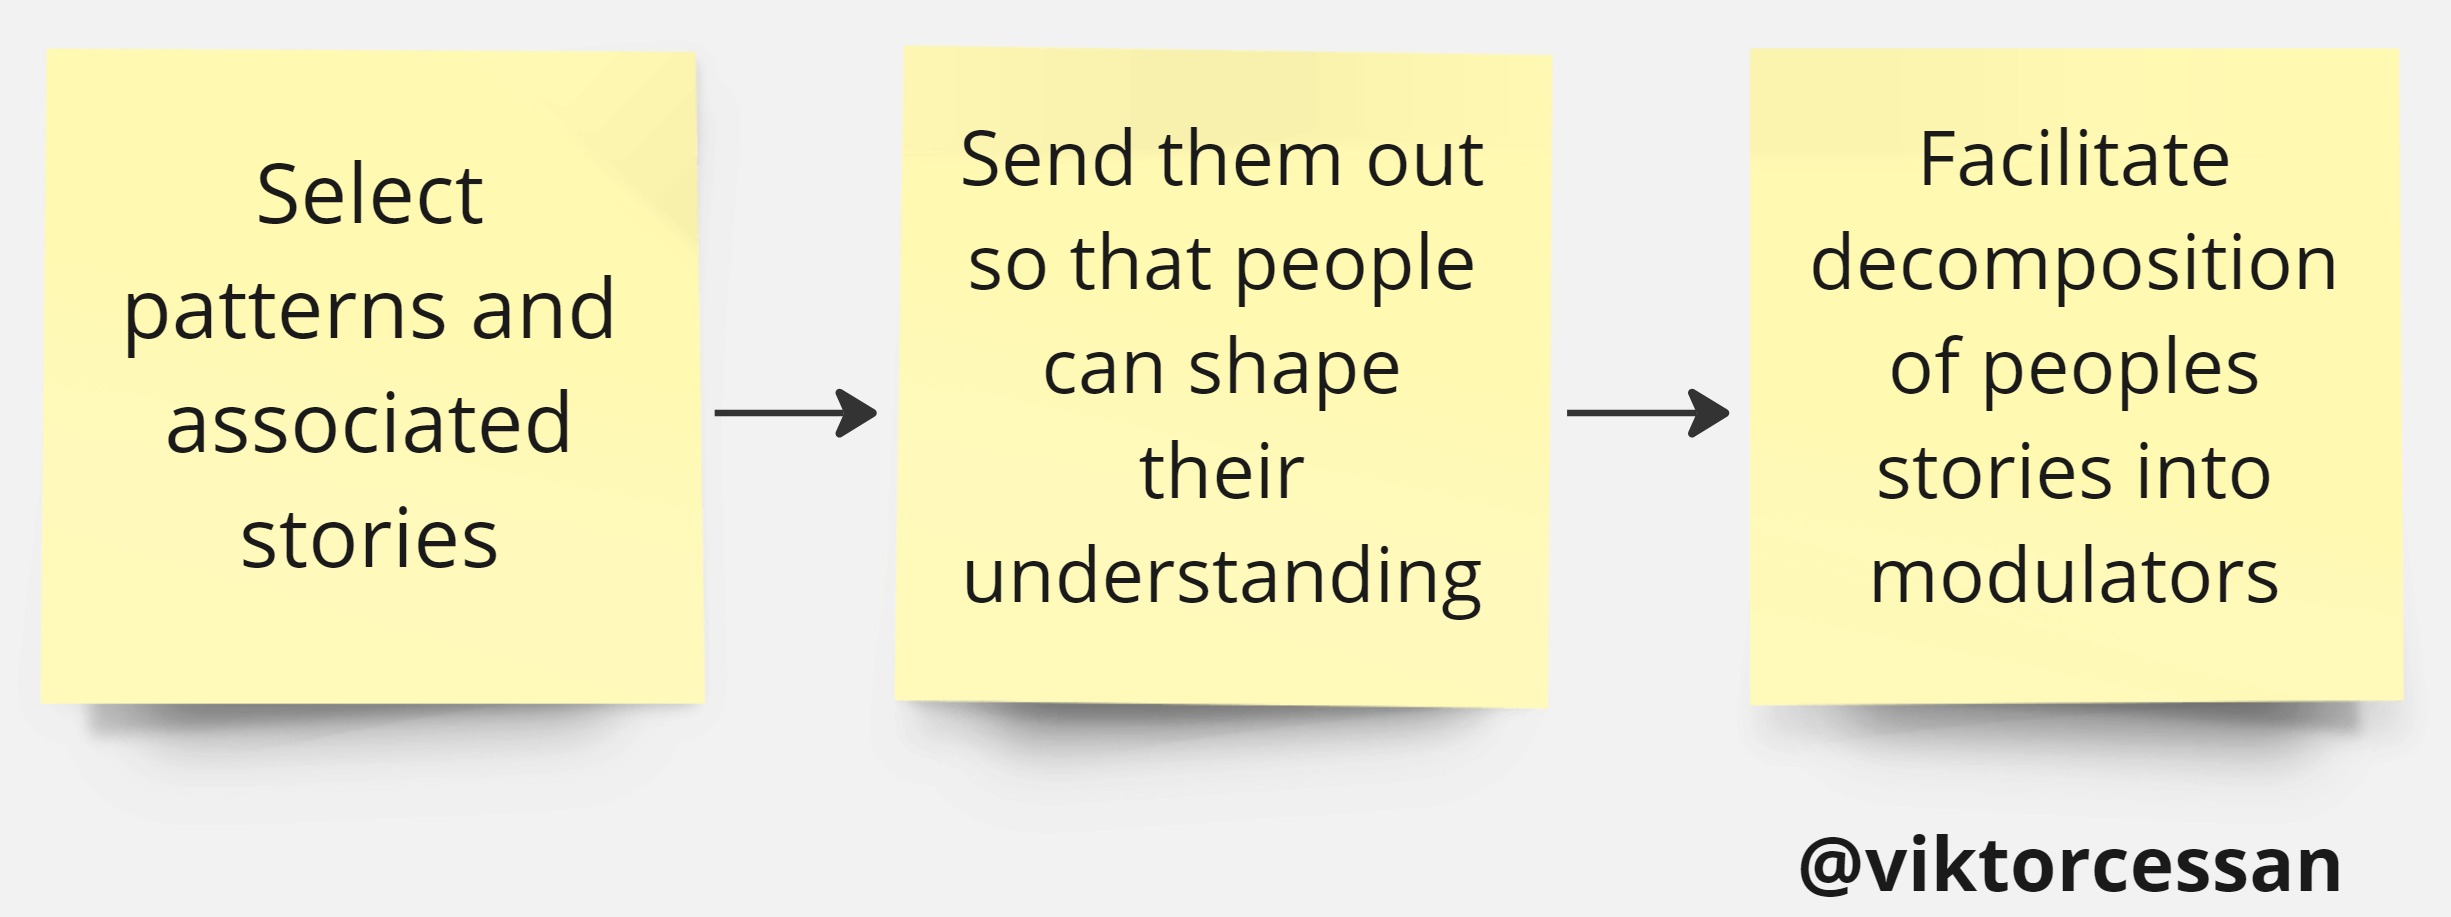
Rather than me reading through all the material and pre-selecting/extracting modulators that the groups will later work with, I should select patterns that stand out, and share them along with their associated stories. I should lead the groups in decomposing those stories into modulators at the lowest granular coherent level.
As an example, below is a pattern that clearly stood out. The visualization is an export from the SenseMaker® platform and it’s called a “Dyadic cross”. This dyadic cross shows two overlaid questions where one is placed on the x-axis, and the other on the y-axis.
In this case, we asked whether people thought technology decisions that impacted them were taken close to them or far away from them. We also asked them whether they perceived the architecture to evolve fast, or slow. We can see that there are three clusters. What are the stories within those clusters? What are the commonalities, and differences?
That’s what I extracted–the visualized pattern, and the stories people shared. And I did not share my own personal interpretation of this pattern.

Another pattern that stands out is the one below. It shows what level people perceive information to be described on, and the proximity of the decisions. As we were exploring the adoption, and diffusion of the technology vision, this was important for us to understand. Early on, through my conversations and anecdote circles, we shaped a hypothesis that codification was happening on a high abstraction but that the technology vision was not codified on a low abstraction leading to diffusion problems. This seemed to support that hypothesis on a pattern level, but we had no idea Why it was this way, something people’s stories later would help us understand.

I continued and went through the stories people shared, exploring triadic and dyadic questions, hoping to find patterns that stood out. To ensure I did not communicate interpretations, I decided to extract an equal amount of stories in any shape or formation that stood out. For example, with the above graphs I extracted 3 stories for each cluster.
As I went through the SenseMaker®, a great deal of patterns stood out. Sometimes the patterns were related to what role people had. Other times, tenure mattered more. Sometimes it was the attitudinal orientation. For example, the triadic questions below shows who people turn to when they have technology questions, divided by role (engineers to the left vs managers to the right).

Creating a story pack takes time
Here’s where I start thinking that this is a lot of work. Am I doing this correctly? It’s taking me hours upon hours to do this and go through the data. At the same time, I feel like I’m just skimming the surface. Jules..? Help?
Jules shares that ideally, a team of researchers ought to go through this. “Researchers” as in facilitators from the Cynefin company. This activity isn’t really a task for a lone agile coach. Having several researchers going through distributes the cognitive load, reduces biases, and allows for better pattern extraction. But it also allows for more objective exploration where we can ask each other “what about this stands out according to you?”.
Now, my wife is an anthropologist, and she’s taught me a lot. I’ve read books on ethnographic interviews, and I’ve run several organizational studies in the past (both quantitative and qualitative), but there’s an art to research. And despite my experiences, at best, on a good day I might pass for an associate researcher.
So trigger warning agile coaches: While I understand the conceptual appeal of Estuarine Mapping, I’m not sure this is an appropriate tool for the type of work we do. At least, I’m sure most of us do not have the proper background and skill-set for running this.
But nonetheless, I created a 30-page story pack. It contains a short background to my work, repeats the questions that were asked, has a data overview, and then goes into triadic and dyadic questions, and stories. I also include a short “How to read the results” which in hindsight proved to be great because this type of pre-read is an unfamiliar activity to most people.

An unexpected discovery related to the pre-read story pack was that in all Estuarine Mapping groups, one participant would read through the story pack carefully, one would skim it, and the third person would not even open it. This seemed to be a universal law at this place. I do not know why.
Estuarine Mapping in small homogenous groups
From my training, I remember Dave talking about the importance of group homogeneity to protect weak signals. Heterogeneous groups will lead to weak signals being filtered out because people will be arguing to try to convince people about their view point.
In my early conversations, some people had expressed a continued interest in contributing further down the road. Some of the story-collector respondents had also reached out and volunteered to participate in Estuarine Mapping. But as this frame was about enterprise architecture, some roles were given. So I planned separate Estuarine Mapping sessions with lead engineers, engineering managers, product owners, enterprise architects, engineering directors, and process managers.
Estuarine Mapping is a task for more than one person
Now that I’ve prepared story packs, identified groups, and sent out invites along with the pre-reads, I’m preparing myself for the Estuarine Mapping sessions. I.e. All of the above, up until now, has been the preparation required in order to be able to do Estuarine Mapping. I can imagine that there are many that think of Estuarine Mapping as a standalone workshop that can be run with minimal preparation. Might be that I did this incorrectly, but the majority of the work was not the actual Estuarine Mapping sessions.
My Estuarine Mapping agenda
I’ve planned six sessions with different groups. Sessions are three hours long, with ten minute breaks every hour. The workshop agenda is:
- Briefly reiterate the background
- Read story pack
- Decompose stories into modulators
- Determine modulator typology (Actant, Constraint, Constructor)
- Plot modulators on the Estuarine map
- Add zones
Jules suggested spending 15 minutes on step 2. For us, step 2 took much longer. One reason was that I’d made the story pack too large. For us it took ~45 minutes to go through the story pack in the first session. I also think this was because I was too present in the content. I kept needing to manage myself, and to bring my attention back to the process rather than the content. But it also took us more time because I first treated steps 2 and 3 as separate.
Continuous story decomposition is better than sequential
In the first session, I gave the group 2×15 minutes to individually read the stories (15m for triadic questions, and 15m for dyadic crosses) during which participants also break down stories into modulators. This was followed by a 2×15 minute conversation where they could agree and disagree, decompose further, and so on.
From session two and forward, I had groups together read, discuss, and decompose one graph/question/story at a time. This approach was much easier for me as a facilitator. And much faster, and easier for the groups.
Pay attention to the modulator size – they’re probably too big
One challenge the groups had was too large modulators, and it was difficult for me to at first understand when a modulator was too large. Because of our session time constraint, I also didn’t push for decomposing stories further. But one thing that made large modulators possible, I think, is that the groups were homogenous. There wasn’t a lot of disagreement.
Having modulators with different sizes made the following steps more difficult: to determine the typology, and to then place modulators on the maps.
In one case, we didn’t have enough time for the typology identification, which wasn’t great because, as I’d notice in my last session, this step leads to better decomposition.
For example, this last group was able to break down 1 modulator into 22 modulators. The gray Hexi at the bottom is the original one.

Story decomposition happens continuously in Estuarine Mapping
Something that I discovered, which was obvious in hindsight, is that decomposition is not a linear process. Groups were not done with decomposition after completing steps 2 and 3. They’d continue decomposing stories and modulators even in steps 4, and 5.
If I would do another round of Estuarine Mapping, I’d try to get to the mapping step/part quicker (like Jules suggested). Because in our case, I had not accounted for additional decomposition in my timeplan, and we couldn’t go as deep into some modulators as groups wanted.
The differences between the maps tell a story in itself
Eventually, I had five Estuarine Maps (one group canceled) that were worlds apart. The maps illuminated polarities that existed, offered nuances, and highlighted entanglement.
As one manager put it: “I’m shocked that something as seemingly simple and straightforward as adoption of enterprise architecture is so messy and has so many things that affect it”.
Meta-decompose differences in zones
The zones differed greatly between groups. I did not explore this further. I would have wanted to if there was more time. For example, the second Estuarine Map is that of Engineering Managers. In this organization, Engineering Managers are expected to manage many of the modulators that they placed in the liminal zone, in their day to day. So it was interesting to see how much that was considered out of reach to them when the organization relies on them. Here I wished I’d had more time to explore the modulators behind not being able to manage what’s in the liminal zone. Although this might in part become an Estuarine Map for another executive frame.
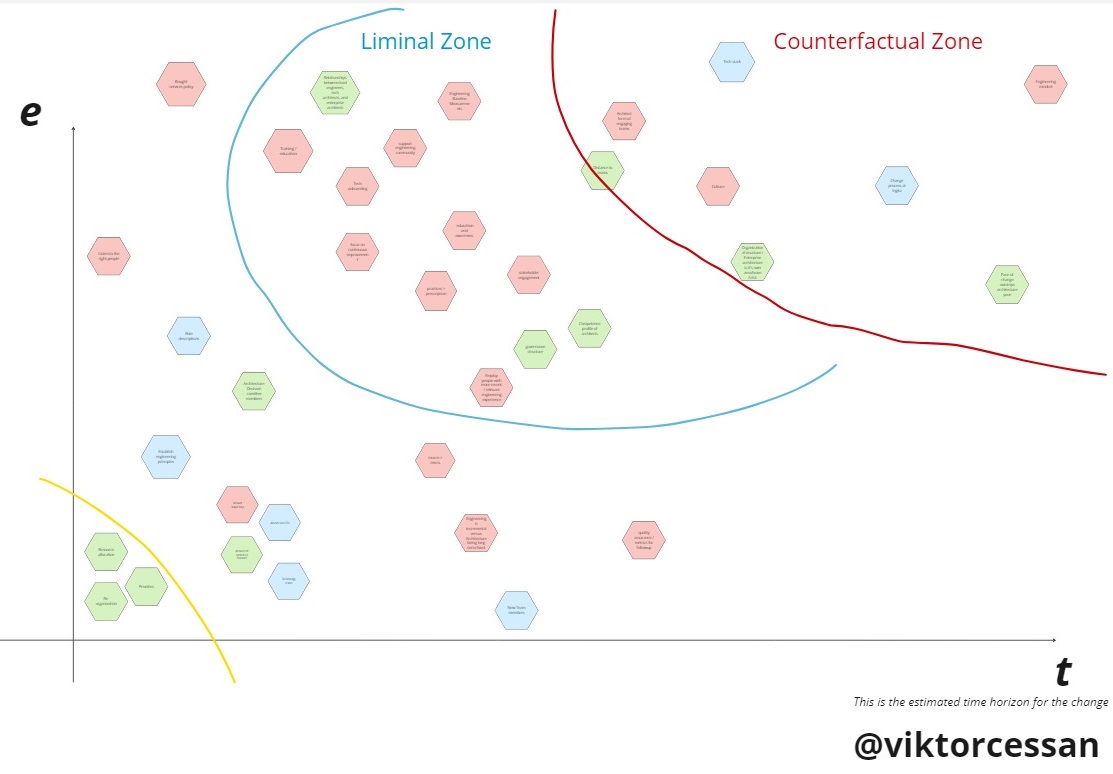
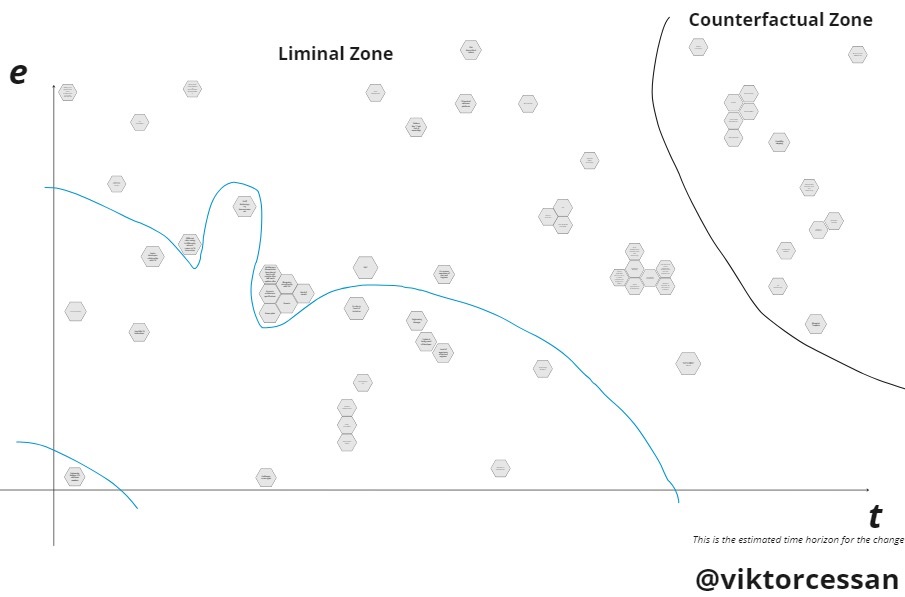
In our case, because we didn’t have time, and because I didn’t know how to capture these stories, those modulators were dark constraints.
Running Estuarine Mapping takes three weeks after which I meet with the CTO, and his chief of staff. Seeing the maps, they want to Estuarine Map with the Senior Management team on their annual offsite that’s coming up, and they reserve a half day for that.
Extract modulators for Senior Management using the other groups’ Estuarine Maps
Like before, when I had no idea on how to move from having peoples stories to having an Estuarine Map, I find myself in a new situation. I don’t know what information to bring when Estuarine Mapping with Senior Management. How much content should I prepare? What content do I prepare? Do I present to them? Do I ask them to read the story packs, and the maps? Do I record something?
We “only” have three hours, and the Senior Management team has twelve members. So I won’t be able to go through the same process as the smaller groups with three participants in which they would decompose stories in the story pack. So what do I do?
Given my constraints for time, and the level of pre-work that is possible, Jules suggests that I pre-select modulators that have come up in the other groups’ Estuarine Mapping sessions. I.e. that I extract the modulator base that the Senior Management team will get to work with.
Selecting interpretations is still filtering/exclusion and I feel uncomfortable with that. I’d be more comfortable with the initial groups suggesting modulators they think are important. But that tide has left the estuary. I select 50 modulators (which turned out to be Way too many), but I feel comfortable in that I haven’t excluded anything mega-crucial. (Probably because I didn’t… 50 equated to 30% of the entire modulator base).
Almost half of the modulators I extract are shared between the groups, and I select some modulators that are unique for each group. In terms of sizing, the modulators varied. Some are properly sized, others were XXL and should ideally have been broken down further first. But I don’t realize this at this point yet. In fact, I realize this after the session when it’s too late to do anything about it.
So, in terms of the process so far. Early conversations led to some observations that led to a SenseMaker® being sent out. Using the collected stories, I prepared a story pack that Estuarine Mappers read before their sessions. I then extracted modulators from all Estuarine Maps to create a modulator base pack that the Senior Management team used in their Estuarine Mapping (they also got the story pack that they could read during the session).

Tenure works as a good divider in heterogeneous groups
As I’m preparing this session, I reflect on how to best divide this team into homogenous groups. The group has a 50/50 gender split. They’re roughly 40/30/30 split between Sweden, India, and other nationalities. In terms of roles, they’re all Senior Managers. And the only thing that made sense to me was to divide them based on tenure.
The members that had been there the longest, had been there over 20 years, and the most recent hires have been there less than 3 months. So we wound up with five groups: 20+ years, 10-20 years, 5-10 years, 2-5 years, and 0-2 years. It really warrants its own post, but the differences in interpretations, focus, and curiosity between the groups was astounding.
Listen to how the groups integrate modulators into their problem solving
The session starts, I reiterate the background, and get them started with mapping as quickly as possible. All groups have discussed and placed out the modulators on their Estuarine Maps. They’ve looked at similarities and differences between the groups’ maps, and it’s time for a lunch break. When we return from lunch, another topic needs discussing before we can continue with Estuarine Mapping. The team is discussing a change they want to make. However, as they’ve just created Estuarine Maps, this conversation goes a little bit different than before. A lot of time is spent on relating the change to the stories people have shared, and to the modulators they’ve been working with. While I felt it wasn’t ideal to pause the Estuarine session, it gave them an opportunity to integrate some of the modulators into their world view.
Be careful with sharing insights, even when asked
Eventually we continue, and as the session nears its end, they ask me for my observations. They would like to know what stood out to me particularly in regards to differences between the groups I’ve run the sessions with.
I share my thoughts, and it’s appreciated. But like before, I don’t know if I’m being the tyrant of the explicit. I tell myself that because these groups have just gone through the process, have worked with the stories and modulators, and have shaped their own understanding, I may share my thoughts.
Senior Management LOVES (the insights they get from) Estuarine Mapping
We wrap up the session with reflection, and Senior Management is very appreciative of Estuarine Mappings. As a few of them state:
“If I would have known then what I know now, I’d have pushed for greater participation”, “I’d love to do this in my organization solely, on other topics”, and “Why aren’t we doing more of this?”
Time requirement increases exponentially
After all sessions were completed and I was “done”, a management team in another area heard about this work and wanted to learn more about the insights. I suggested they go through the process to understand it, the data, and insights that came out. The group agrees.
The group consists of five members, and despite setting aside four hours, we didn’t get as far as the smaller groups with three members in three hours. There was more conversation, disagreeing, and exploration than with the other groups. I observe more attempts at creating a shared narrative and convincing each other of one’s own interpretation. I am not sure if this is due to their more heterogeneous nature, or because I now am better at facilitating this, having now gone through it a few times.
But I’m still stuck with how long this takes. I remember from my training that Dave mentions this can be done in 2×4 hours. “A half day to go through complexity science, and to introduce Estuarine mapping, followed by an afterwork, followed by the mapping on the morning after”.
I am nowhere near being able to hold that timeline.
Improvements happened, but not the way I expected
We’re now at the end of my experience with Estuarine Mapping. What started with a town-hall and me having casual conversations with people, is now leading to unexpected and organic actions.
I was expecting to facilitate additional Estuarine Mapping sessions where we identified probes, experiments, and actions to take. But we didn’t get there. Senior management is too large, globally distributed, and occupied with day-to-day operations to effectively be able to do that.
But despite no additional sessions, I’ve noticed changes happening organically following the Estuarine Mapping. Some changes have been as simple as reviewing access restrictions for documentation, and creating a new storage policy for documentation. Other things included hiring different profiles, instituting a new forum where developers and CTO met directly to discuss the enterprise architecture, and moving from siloed ownership of enterprise architecture.
The CTO later followed up with me mentioning that this gave them a better understanding of the ontology, and the phenomenology.
What did this cost? Was it worth it?
A quick back of the envelope calculation returns a cost of barely $40000 over 10 months. This includes all time and material–my time, people responding to the SenseMaker®, workshop participants, planning, and the cost of the SenseMaker®.
This topic has been a long endeavor for this client, and according to them, in this process, they came together in new ways and discovered things they would not have otherwise. They’ve also made changes that they have confidence will make a difference.
In large organizations, it’s often very difficult if possible at all to break conventional wisdom. But what cost does breaking it warrant? There’s going to be a different answer in every organization.
But, as I hope I’ve made it clear above, it would have been good to spend more time on this which would have raised the cost further. So in terms of the cost, and whether it’s worth it, I am neutral. But I’m sharing my personal cost estimate again as a way to encourage deliberate thinking around whether or not you think your organizational tension requires a full Estuarine Mapping process.
Ensure the liability remains with the client
After Senior Management had conducted the Estuarine Mapping, and actions started happening in multiple parts of the organization, much still remained to be done in my view. We didn’t talk about complexity science, and we did not go into any particular depth regarding typologies. On a high level, they understand that there are different typologies, but not necessarily why it matters to them and how they can leverage that knowledge.
As the facilitator of this, I would have loved it if we could have spent more time on that, but the time is not right. I see some early signs of them wanting to continue this after the summer, so I’m letting this wait until then. And even if they don’t pick it up again, ultimately, it’s their decision. If I would try to continue by for example booking in meetings with them that they didn’t request, I would be taking over liability and decreasing their ownership. That’s not a good place to be in. So, again, I find myself practicing patience.
There were many occasions throughout this process where I could have fallen into the pitfall of moving the liability to myself, but I actively resisted doing so, even when it felt bad to do so. For example, despite having gone through this process and having helped groups interpret stories, I’m not going on a roadshow sharing mine and others interpretations. That’s something they have to do. I could support them in doing this if they request it, and own it, but I can’t initiate and drive this myself. Because that would be me taking over liability.
Throughout this process, I constantly paid attention to the liability. Who’s owning the knowledge that’s being created, and the process of creating it, is it me, or is it the client?
Summary of my lessons learned
Through facilitating Estuarine Mapping, I’ve learned a lot that I did not in the training I attended. The process, from start to end in my case, looked like the below.

While several discoveries and insights are listed above, here’s a listed summary of my insights in no particular order:
- Estuarine mapping isn’t for everyone, nor for every problem you can think of – It’s not for “getting an organization to do your favorite agile problem”.
- Agile coaches, Engineering Manager, HR, VPs of X, you’re probably more suited to participate in the creation of an Estuarine Map, than to run it.
- Design for prompt elegance using a decent amount of questions.
- Use language native to the context.
- The initial prompt is absolutely crucial to orient people’s thinking for the rest of the story-collector.
- Executive sponsorship, for a lack of better words, is very important.
- Sense-making, and SenseMaker® are to surveys what gasoline is to an electric car.
- Get a mentor if it’s the first, or even second time you’re doing this.
- You should be a team conducting this.
- Continuously scan for liability transferral.
- Reserve ample time – mapping with 5 takes double the time it takes with 3.
- Different groups desire different levels of structure and definitions. Some are fine having a good enough typology. Others want to identify the exactly proper typology of the modulators.
- Mappers don’t need to be complexity science experts to participate and contribute to map creation. Spend your time and energy on story decomposition instead of complexity science.
- The questions “What can be managed”, “What roles, processes, rituals, people, etc contribute to this story”, “Who can influence this pattern” are helpful guiding questions for the decomposition.
- The first decomposition is always too big.
- The second decomposition is always still too big.
- The third decomposition starts getting there.
Thank you for reading this, and I hope it brings value to you in your mapping process.
3 Comments
Jules Yim
It was a pleasure working with you, Viktor, but even more so to read your recap of the journey through your perspective.
“Third time lucky” decomposition is definitely one of the big lessons I’ve taken away from this journey too.
– J
Marco Böttcher
Thank you for this in depth look at doing Estuarine Mapping. I was lucky recently to participate in a Workshop with Dave Snowden about EM and am now hooked to try it out. Your article helped me to further add to the picture and knowing firsthand about pitfalls is just priceless.
I was planning to do a practice session more or less like you did with the hexis kit in your last post. Pick a topic like public transport, narrow it down a bit as a starting point for decomposition, modulator building and mapping.
Since I’m missing crucial parts and am not starting from stories…
Do you have any pointers apart from your important summary points I could adopt beforehand or need to have a lookout for during facilitation?
Thank you and sunny vibes from Berlin
Marco
Pavle
Dear Viktor,
Thank you for sharing your experience with using SenseMaker and Estuarine Mapping. It was very interesting to read how you approached it and the challenges you encountered. You described everything quite clearly and in detail, so I don’t have any particular uncertainties.
What caught my attention was how you combined SenseMaker and Estuarine Mapping, specifically how you used insights from SenseMaker to create the Estuarine map. That really seems like a challenging task. What do you think—if you had done Estuarine Mapping without the insights gained from SenseMaker, would the results have been significantly worse? Does it make sense to start Estuarine Mapping without first conducting a SenseMaker study?
Once again, thank you for the blog post.
Best regards,
Pavle